Restaurant Analytics: 5 Numbers Worth Checking Every Week
Most restaurant owners have more data than time. Sales reports, order lists, supplier invoices and online reviews all pile up, and it is hard to tell which of them should change a decision. This guide is for owners and managers who want a short, repeatable routine.
By the end you will know the five restaurant analytics worth checking every week, how to calculate each one, and what to do when it moves. Each section has an example. The numbers in the examples are illustrations, not benchmarks, so swap in your own.
What restaurant analytics should you track?
Start with five numbers. Each one answers a question you can act on within a week:
Number | The question it answers | A typical action |
|---|---|---|
Sales by period | Are we growing, flat or shrinking? | Investigate the weeks that dip |
Average order value | How much does each order bring in? | Adjust bundles, add-ons, menu layout |
Best and worst sellers | What earns its place on the menu? | Promote, reprice or drop items |
Online vs walk-in split | Where do sales come from? | Put effort into the bigger or faster-growing channel |
Busy and quiet periods | When do we need more or fewer people? | Change shift plans and prep |
Pick one day each week, for example Monday morning, and look at the same five numbers for the previous week and the one before. Trends matter more than any single day.
The US Small Business Administration makes a related point in its guide to managing your finances: separating segments of your business, such as online and in-person sales, gives you insight you would not get from one combined total.
How do you read sales by period?
Total sales is the base number. Pull it for the last seven days, the seven before that, and the same week a month ago. Look for a direction, not a verdict.
A single weak Tuesday is noise. Three weak Tuesdays in a row is a pattern. Check the calendar before you react: school holidays, weather, payday timing and local events all move sales without anything being wrong with your restaurant.
Use a custom date range so you compare like with like. Comparing a full week to a half week is the most common reading mistake.
How do you work out average order value?
Average order value (AOV) is total sales divided by the number of orders. It tells you how much each order is worth before you spend anything on getting a new customer.
A worked example (illustration)
Say a restaurant takes 100 orders a day and its AOV rises from $42 to $47. That is $5 more on each order, so $500 a day. Over a 30-day month that is $15,000.
The point is the arithmetic, not the size of the jump. Whether you can raise AOV by $5 depends on your menu and customers. Small changes that restaurants commonly test include:
Suggesting a drink or side as part of a combo.
Moving a high-margin dish to a more visible spot in the menu.
Offering a size or topping upgrade at the point of ordering.
Change one thing at a time and compare the week before and after. If AOV rises but orders fall, the change may be putting people off.
Which dishes are your best and worst sellers?
A product performance report shows how many of each item you sold in a period. Sort it two ways: by units sold and by sales value.
A dish that sells in large numbers but earns little per plate keeps the kitchen busy for small returns. A dish that sells rarely but earns well may deserve better placement or a clearer description. A dish that sells almost nothing for several weeks is a candidate to remove, which also shortens prep and simplifies the menu.
Sales data tells you what sells, not what earns. To judge profit you also need what each dish costs you. Work that out separately with our food cost calculator, and read the glossary entries on food cost percentage and prime cost.
A worked example (illustration)
If your food cost runs 2 percentage points higher than planned on $50,000 of monthly sales, that is $1,000 a month, or $12,000 a year. The gap usually comes from portion sizes, waste or supplier price rises, and it only shows up when you compare actual costs with the cost you planned for each dish.
How do you compare online and walk-in sales?
Split total sales into online orders and walk-in orders. Then, if you also sell through delivery apps, keep those separate again, because they carry commission and your direct orders do not.
If online orders are growing, spend time on your ordering page, photos and menu wording. If walk-in is still the larger share, look at table turn times and what staff suggest at the table. If a large share comes through apps, work out what that costs you with the commission calculator.
Direct online orders are also the only channel where you have the customer's order history, which brings us to a number many owners skip: how many people order more than once. If you have customer accounts, count how many customers placed a second order within a month. You do not need a special report for this. A weekly list of repeat customers is enough to tell you whether people come back.
How do you find your busy and quiet periods?
Look at the time stamps on your orders for a month. Group them by day and by hour. Most owners find at least one surprise, for example that the real rush starts 30 minutes earlier than they thought.
This matters for labour, which is usually your largest controllable cost. Matching staff to demand means fewer idle hours in quiet periods and fewer overwhelmed shifts at the peak.
A worked example (illustration)
If you pay $15 an hour and find one hour a day where nobody was needed, removing it saves $15 a day, or $5,475 a year (15 x 365). Your wage and the number of hours will differ. The point is that one finding, repeated every day, becomes a real number on your profit and loss.
Also use your online reach. Google's help pages explain how to understand your Business Profile performance, including calls, website clicks and direction requests, which helps you see how people find you before they order.
Common mistakes to avoid
Tracking too many numbers. If a number never leads to an action, stop looking at it.
Comparing unequal periods. Use the same length and, where possible, the same weekdays.
Reacting to one day. Wait for a pattern across several weeks.
Changing five things at once. You will not know which change worked.
Mixing channels. Blended totals hide the commission you pay on app orders.
Treating sales as profit. Sales reports do not include your costs. Combine them with food cost and labour.
How FoodFlick helps
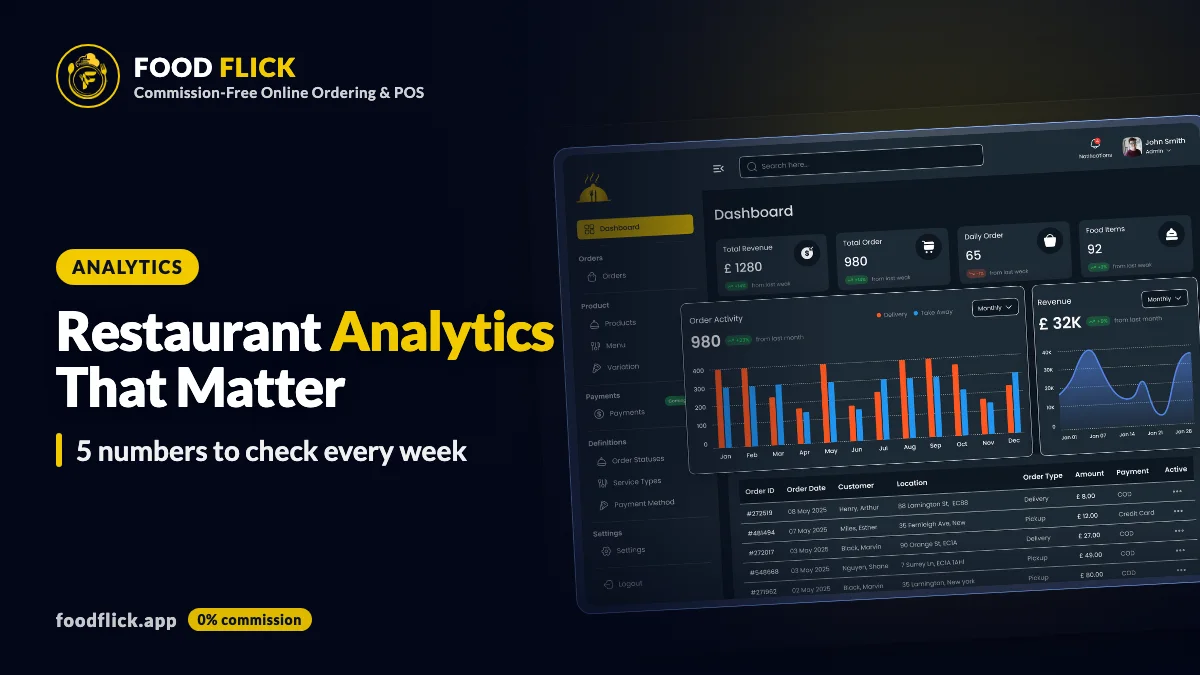
FoodFlick is a commission-free online ordering and POS platform that keeps online and walk-in orders in one place, so your channels are not split across separate reports. Its sales reports cover custom date ranges, with product and menu performance and dashboards, and customer accounts keep order history. It does not replace your supplier invoices or stock counts, so keep those for food cost. See how it works on the restaurant POS page or compare plans and pricing.
Sources
US Small Business Administration: Manage your finances, checked November 2026
Google Business Profile Help: Understand your Business Profile performance and insights, checked November 2026
Frequently asked questions
What restaurant metrics should I track every day?
Daily sales, number of orders and any cancelled or refunded orders are enough for a daily glance. Save the deeper questions, such as average order value and item performance, for a weekly review where you can compare against the last few weeks.
How do I calculate average order value?
Divide total sales for a period by the number of orders in that period. If you took $9,000 from 200 orders last week, average order value is $45. Use the same definition each time, for example before or after tax and tips.
How often should I review restaurant analytics?
Weekly works for most owners, because it smooths out one-off busy or quiet days. Do a longer review monthly to spot trends, and look at individual days only when something unusual happens, such as a holiday or a big local event.
Do I need special software for restaurant analytics?
Not to start. A spreadsheet and an export of your orders is enough. A POS or ordering system with built-in sales reports saves time because the numbers update themselves and online and in-store sales sit in one place.
Is food cost an analytics number I should track?
Yes, but it usually comes from your supplier invoices and stock counts, not from sales reports alone. Work it out separately, then compare it with your menu prices. A food cost calculator can show the cost of each dish.